


D4U Review: Inapptics. New Level of App Analytics.
D4U Review: Inapptics. New Level of App Analytics. New issue of D4U review introducing Inapptics, a new tool for app analytics providing creators with loads of useful information about users' interactions.
There are so many things happening in the design community worldwide that sometimes it’s easy to get lost in the waterfall of new tools, plugins, updates, trends, and services. That’s is why here in Design4Users we share D4U Reviews – brief introductions of products and services which may be useful and helpful for our readers.
You will definitely hear from every product designer that the moment when you launch your app is up to users is not the finale. It’s just the beginning of a new stage, new wave, the new way to consider and analyze. Today we are presenting you the tool called Inapptics which unites designers, developers, product managers, and marketing specialists providing them with deep analysis of user interactions with the app.
Problem to solve
The problem which was considered by Inapptics team roots in the fact that there is a great abundance on the market of mobile applications, still 90% of apps downloaded are used only once and are eventually deleted. App creators, investing their time, effort, and money into digital products, struggle to understand why that happens as there is a lack of visibility on what users exactly do in their apps. Understanding where users touched, how they navigated, and when exactly the app crashed is a crucial necessity, but it’s not possible to track with current mobile analytics tools that provide statistical numbers and charts.
With current analytics solutions (e.g. Google Analytics, Mixpanel, and others) app creators usually get a bunch of numbers and charts, but the research showed the issues which app makers need to get answered are the following:
– Is their app being used as intended/designed?
– Are there any usability issues?
– What exactly was the user doing that caused the crash they cannot reproduce?

Features
In order to start using the aforementioned tools, a developer needs to spend days and program every single event that needs to be tracked. Sometimes it can take up to two weeks until it’s fully up and running. This is the perspective which Inapptics team got for building a new useful tool solving the mentioned problem.
To start using it, you simply add the SDK to your app and add 1 line of code. Then the tool automatically captures all the actions performed by the app users, like where they tap and how they navigate. The collected data is then analyzed and visualized as a flow of screens, visual funnels, and touch heatmaps. As a bonus, the tool also detects crashes and replays the exact steps that lead to the crash.
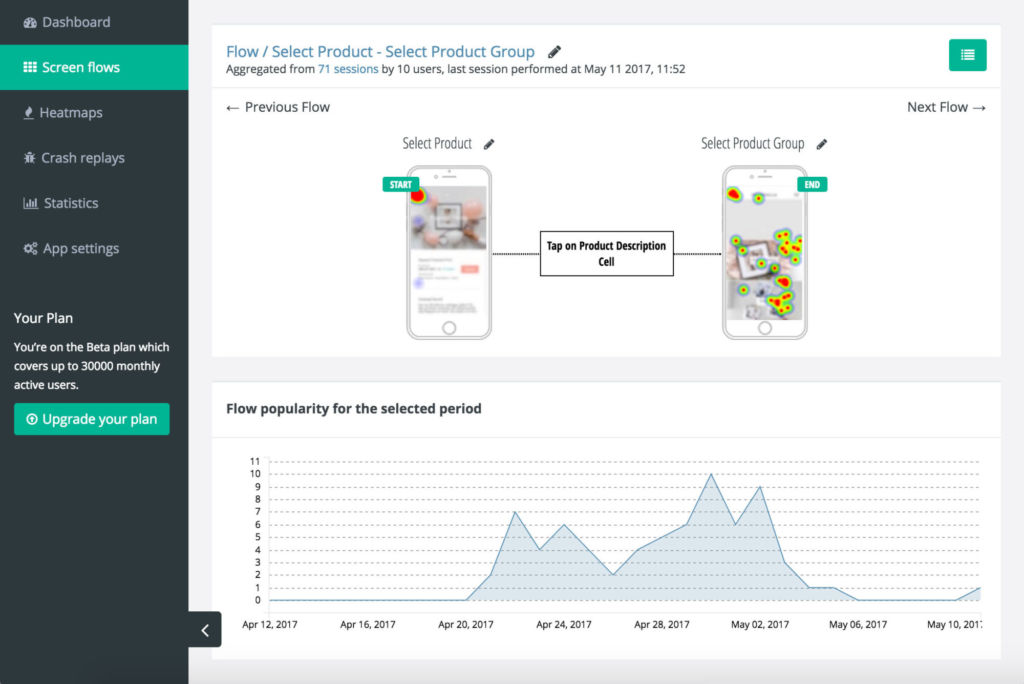
The page of screen flows
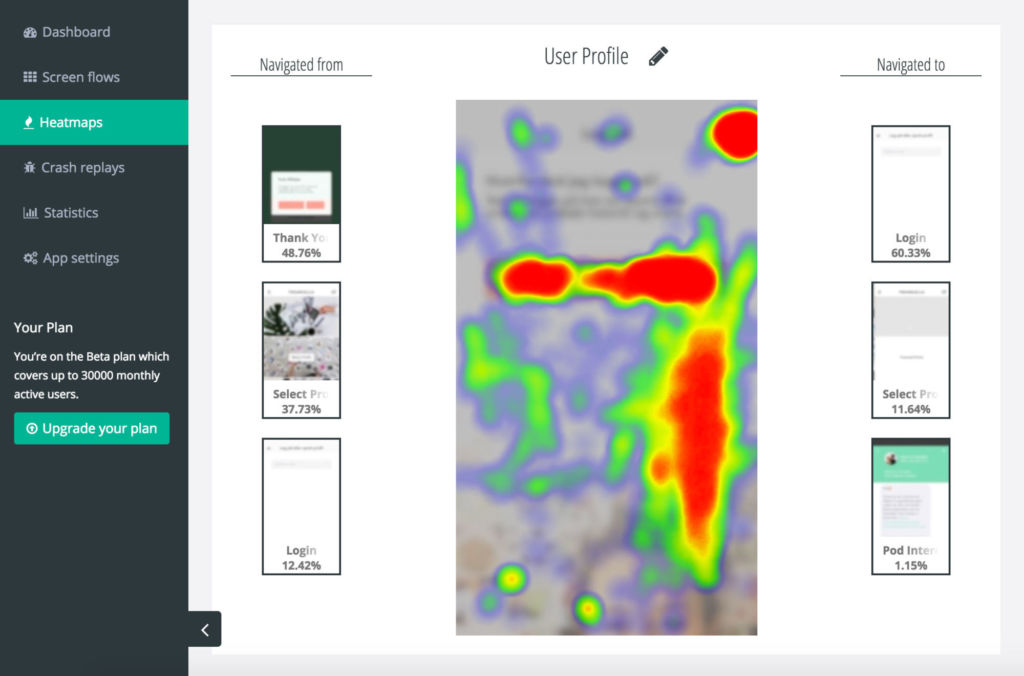
The heatmaps enabling to see the areas of high interaction
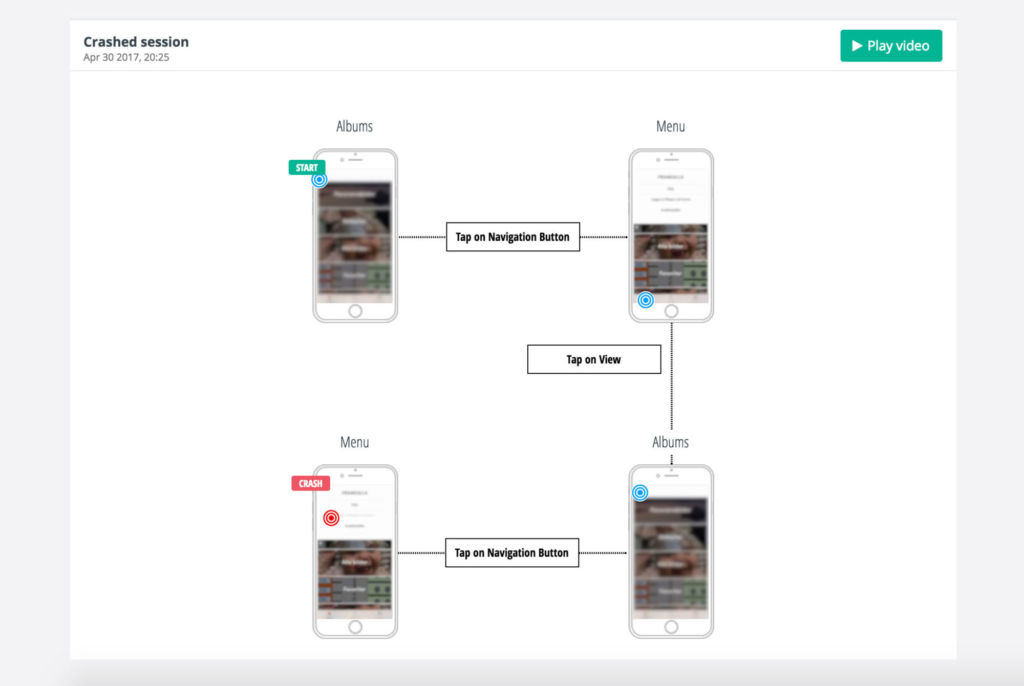
The app enables to replay the crash sessions and see what step the session flow got broken
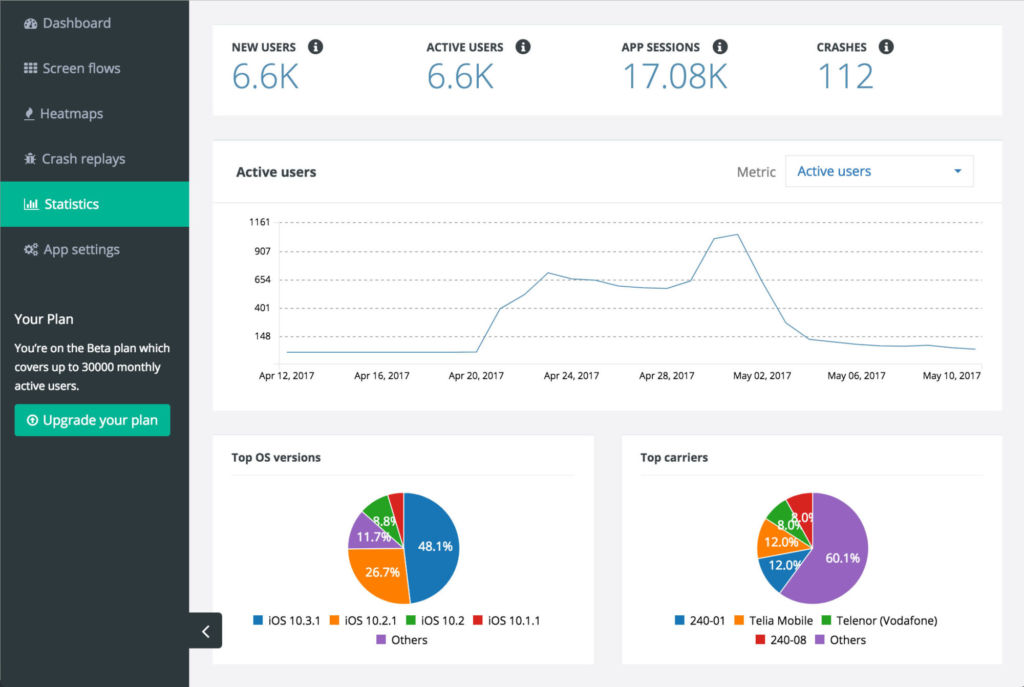
Statistics page presents the collected data in infographics
Benefits
Traditional analytics tools are pure metric based analytics, where app developer programs each individual event and then the tool tells you how many times each event was triggered. With traditional analytics tools like Google Analytics or Mixpanel, you have to know what you need to track, which is not easy. Inapptics does not require the programming of any event, it captures all events automatically and most of the time provides insights the app owner has not even been thinking about.
There are also session recording tools that record the video of the user session in the app. But there is a big problem with those tools. You can’t aggregate data from videos. So if you have thousands of users, most likely you are not going to watch thousands of video recordings. And there is no way to filter those videos to know which session recordings need your attention and which don’t. Inapptics solves this issue, as it does not just records but also gathers data points of every user interaction in the app and then aggregates that data. So if 100 people did the same thing in the app, it is shown as one flow performed by 100 people. Of course, you can dive into individual sessions if you wish, as this information is provided too.
Pricing
Inapptics is free for apps with less than 1000 monthly active users (MAU). If your app has more than 1000 MAU then you can upgrade to one of the paid plans that start at $99/month. Full pricing information is available here.
Contributed by Inapptics team
- English
- Ukrainian